

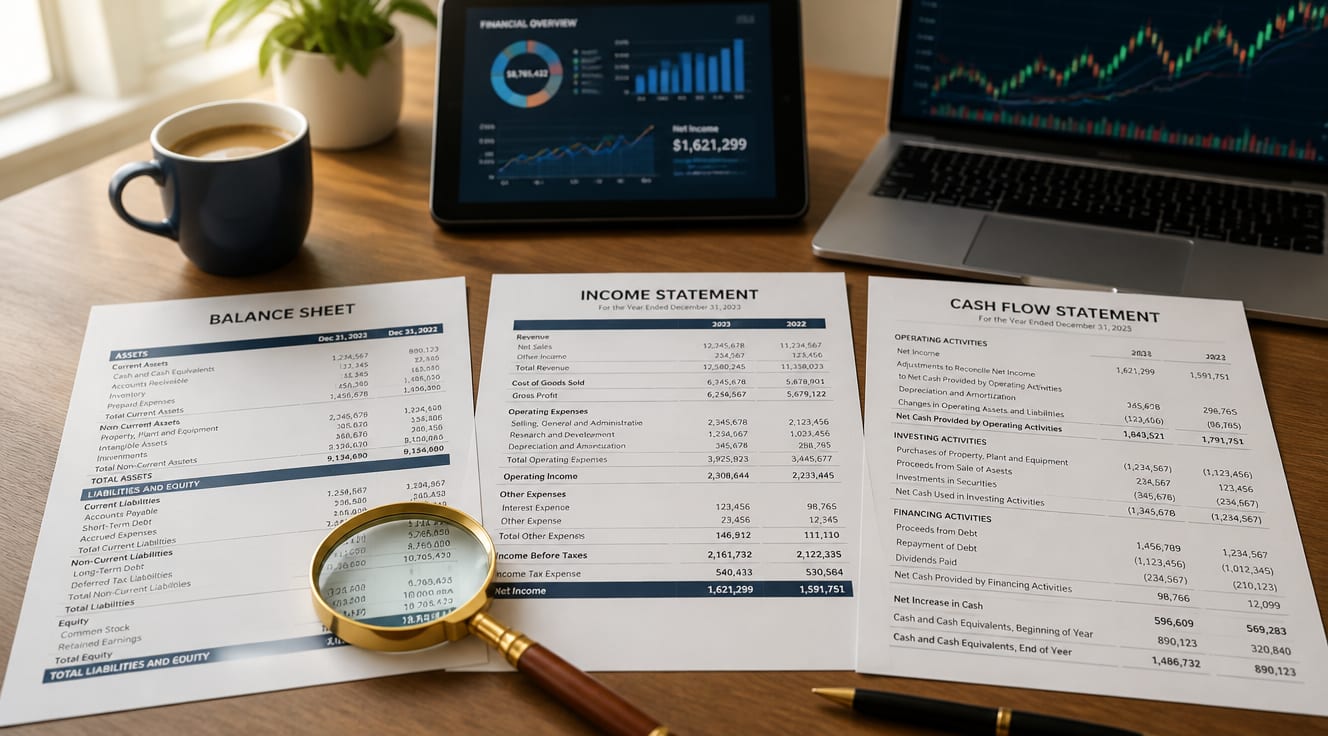
Learning how to read financial statements gives you a transparent, line-by-line view of any company’s financial health, profitability, and cash position. The three core documents—the balance sheet, the income statement, and the cash flow statement—reveal whether a business is stable, growing, and worth your investment. According to FINRA’s 2021 National Financial Capability Study, only about 34% of U.S. adults correctly answered basic questions about investing risk and return, which makes statement-reading a serious competitive advantage for the few who master it.
What Are the 3 Core Financial Statements and What Do They Show?
Every public company files three fundamental financial statements that work together as a single financial dashboard. When you learn how to read financial statements as a system, you avoid the common trap of judging a business by one number in isolation.
| Statement | What It Measures | Key Question It Answers |
|---|---|---|
| Balance Sheet | Assets, liabilities, and equity at a specific moment | How much does the company own versus owe? |
| Income Statement | Revenue, expenses, and profit over a period | Is the company actually profitable? |
| Cash Flow Statement | Cash inflows and outflows across operations | Does the company generate real cash? |
Think of these three reports as cameras filming the same business from different angles. Each view is needed to confirm what you are seeing.
How to Read a Balance Sheet Step by Step
The balance sheet is a snapshot of value on a single date. A 2023 CFA Institute survey found that 67% of beginner investors describe the balance sheet as the most intimidating document, mostly because of unfamiliar accounting language rather than complexity. The accounting equation itself is simple:
- Assets = everything the company owns (cash, inventory, property, equipment).
- Liabilities = everything the company owes to creditors and suppliers.
- Shareholders’ equity = the residual claim of owners after liabilities.
If the equation does not balance on the page, that is an immediate red flag. Compare current assets to current liabilities to test short-term liquidity, and divide total liabilities by total equity to measure financial leverage.
Decoding the Income Statement: Revenue, Expenses, and Profit
The income statement tracks performance over a quarter or a full fiscal year. It starts with revenue at the top and ends with net income at the bottom. Reading it top to bottom shows you exactly where money is absorbed:
- Revenue – total money earned from goods or services sold.
- Cost of goods sold (COGS) – direct costs of producing what was sold.
- Gross profit – revenue minus COGS, before operating costs.
- Operating expenses – R&D, marketing, salaries, depreciation.
- Operating income – profit before interest and taxes (EBIT).
- Net income – the bottom-line profit after everything else.
Watch the gap between gross profit and operating income. A widening gap signals rising overhead that may threaten long-term profitability.
Why the Cash Flow Statement Often Tells the Real Story
The income statement can be smoothed with accounting estimates. Cash is harder to fake. According to McKinsey’s 2022 report The Rising Power of the CFO, companies converting more than 90% of net income into operating cash flow outperformed the broader market by roughly 2.3 times over a decade. That is why seasoned investors always check cash flow.
The cash flow statement breaks money movement into three sections:
- Operating activities – cash generated from the core business.
- Investing activities – cash spent on long-term assets such as equipment.
- Financing activities – cash exchanged with lenders and shareholders, including debt, dividends, and buybacks.
5 Financial Ratios That Bring the Numbers to Life
Raw figures alone lack context. Ratios translate raw numbers into comparable signals.
| Ratio | Formula | What It Reveals |
|---|---|---|
| Current Ratio | Current Assets ÷ Current Liabilities | Short-term liquidity health |
| Debt-to-Equity | Total Liabilities ÷ Shareholders’ Equity | Financial leverage and risk |
| Gross Margin | Gross Profit ÷ Revenue | Pricing power and efficiency |
| Return on Equity | Net Income ÷ Shareholders’ Equity | Effectiveness of reinvested capital |
| Free Cash Flow Margin | (Operating Cash Flow − CapEx) ÷ Revenue | Real cash-generating ability |
The SEC reports that retail investors now account for nearly 25% of U.S. equity trading volume (2022 data). Yet most still skip ratios entirely, missing the very tools that drive consistent results.
A Real-World Example: Reading Apple’s FY2023 Financial Statements
Apple’s fiscal year 2023 10-K filing is a textbook case of how the three statements connect. The balance sheet reported total assets of roughly $352.6 billion against total liabilities near $290.4 billion, leaving shareholders’ equity of about $62.2 billion. The income statement recorded $383.3 billion in revenue and $97.0 billion in net income—a net margin close to 25.3%. The cash flow statement disclosed $110.5 billion in operating cash flow against just $10.9 billion in capital expenditures, producing nearly $100 billion in free cash flow. Used together, these figures confirm a business model with extraordinary efficiency, low leverage, and durable competitive advantage.
What Mistakes Should Beginners Watch Out For?
- Confusing profit with cash; a profitable company can still run out of money.
- Ignoring footnotes and accounting policies where critical context is hidden.
- Comparing companies using different accounting standards or fiscal years.
- Focusing on a single metric instead of the full statement picture.
- Skipping the cash flow statement because it looks dense.
How Can You Start Reading Statements Today?
- Download a free 10-K filing for a company you already buy from—Apple, Nike, or Starbucks—and read it cover to cover.
- Use the SEC’s EDGAR database at sec.gov/edgar to access any U.S. public company’s filings.
- Pick one financial ratio each week and calculate it for two competing companies.
- Re-read the same statements a month later to test your retention and confidence.
- Keep a short journal summarizing trends in revenue, margins, and cash flow for every company you study.
Frequently Asked Questions
How long does it take to learn how to read financial statements?
Most beginners can grasp the basics of how to read financial statements in four to six weeks of consistent practice. Mastering ratio analysis and footnote interpretation usually takes three to six months of steady study.
Do I need an accounting background to read financial statements?
No accounting background is required. A curious mindset paired with beginner-friendly resources such as Investopedia or the CFA Institute reading list is enough to build practical reading fluency.
Which financial statement should beginners look at first?
Start with the income statement to understand profitability, then move to the balance sheet for stability, and finish with the cash flow statement to verify earnings quality.
Are audited financial statements 100% reliable?
Audited statements are highly reliable but not infallible. Material misstatements can still slip past auditors, which is why reading the footnotes and management’s discussion is essential context for any investor.
Where can I find free financial statement data online?
The SEC’s EDGAR database, Yahoo Finance, Morningstar, and each company’s investor relations page all provide free access to multi-year financial statements for public companies.